
From a Dot to a World: JWST Maps an Alien Atmosphere in 3D for the First Time
For decades, the thousands of planets we’ve found outside our solar system have been little more than shadows. We knew they were there. We could see them as faint “dots,” measure their size, or see the dip in starlight as they passed by their stars. And we knew many had atmospheres. We’ve even been able to “sniff” those atmospheres to find chemicals like water vapor or sodium. But we could not see them as real, three-dimensional places. We had lists of chemicals, not global weather patterns. We had flat, 2D temperature estimates, not true, 3D climates. They were statistics, not worlds. Therefore, a new discovery has completely changed the game. For the first time, astronomers using the James Webb Space Telescope (JWST) have published a full, comprehensive, three-dimensional (3D) map of an alien planet’s atmosphere. They have turned a distant point of light into a true, 3D volume. What they found is a world of violent extremes, more bizarre than we could have imagined.
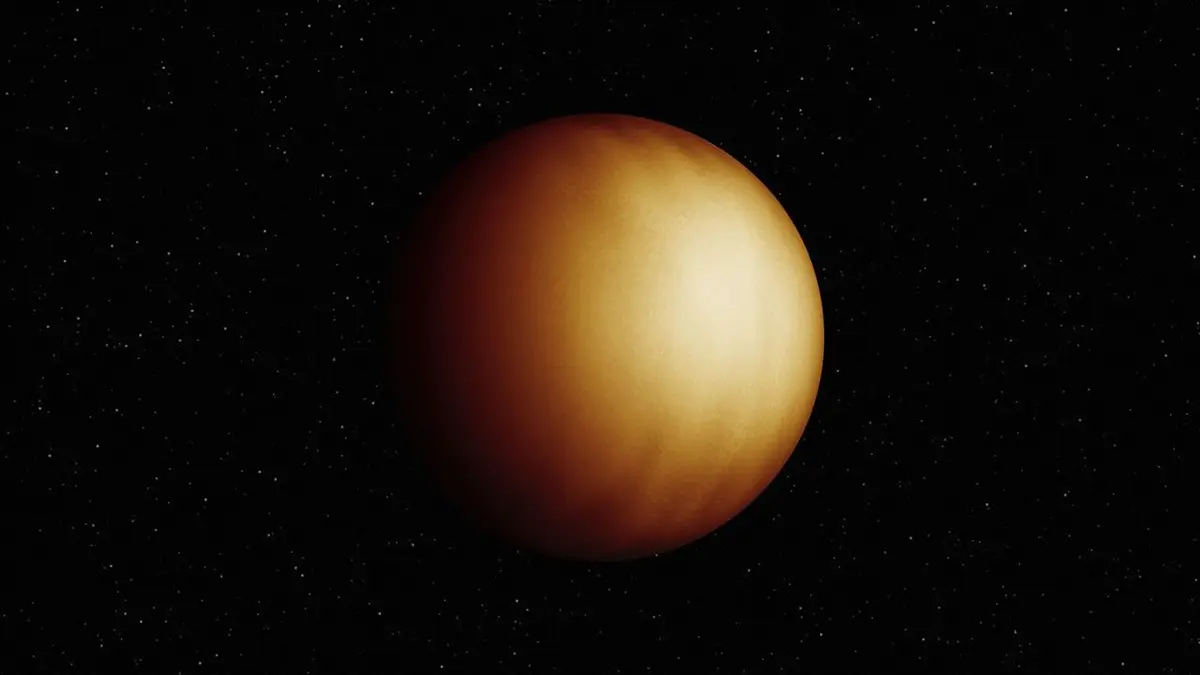
The core finding is this: the planet, an “ultra-hot Jupiter” named WASP-18b, has a scorching-hot dayside that reaches nearly 5,000 degrees Fahrenheit (2,760°C). This temperature is so extreme that it “literally tears water molecules apart”. The 3D map is the first direct, observational proof of this long-theorized process. It shows a world with distinct temperature zones, varying chemical compositions, and a full vertical profile. This is not just a better picture. It is a new kind of science. It marks the dawn of comparative, 3D exoplanetology.
What Exactly is an Exoplanet?
Before we dive in, let’s get our terms straight. What is an exoplanet? An exoplanet, or extrasolar planet, is simply any planet located beyond our own Solar System.1NASA. (n.d.). Exoplanets. NASA Science. https://science.nasa.gov/exoplanets/ The vast majority of these planets orbit other stars. Some, however, are “rogue planets” that float freely through the galaxy. As of 2025, scientists have confirmed the existence of over 6,000 exoplanets, with thousands more candidates waiting to be verified. The planet in this study, WASP-18b, is one of these confirmed worlds. It is a gas giant located 400 light-years from Earth. It is classified as an “ultra-hot Jupiter,” a class of planets defined by their immense size and extreme proximity to their host stars. WASP-18b is a monster. It is roughly 10 times the mass of our own Jupiter, but it orbits its star in a blazing-fast “year” that lasts only 23 hours. This incredibly tight orbit means the planet is tidally locked. One side, the “dayside,” permanently faces the star’s blistering heat, while the “nightside” is in permanent darkness.2Brunning, G. (2025, November 6). Scientists use James Webb Space Telescope to make 1st 3D map of exoplanet… Space.com. https://www.space.com/astronomy/exoplanets/scientists-use-james-webb-space-telescope-to-make-1st-3d-map-of-exoplanet-and-its-so-hot-it-rips-apart-water
How Can You Map a Planet You Can’t Even See?
This is the most brilliant part of the discovery. You are correct. It is impossible to take a direct picture of WASP-18b. The planet is far too small, too distant, and completely “hidden by the bright glare” of its host star. So, how do you make a 3D map of a place you cannot see? You do it by measuring tiny, precise changes in light over time. The team used a revolutionary new technique called “3D spectroscopic eclipse mapping”. Think of it as a cosmic “CAT scan” for a planet’s atmosphere.
First, the scientists performed the “eclipse” part. This involves using the secondary eclipse method. They pointed the powerful JWST at the star while the planet was visible beside it. At this point, they measured the *total* light coming from the system (Star + Planet). Then, they waited patiently for the planet to move *behind* its star. This event is the “secondary eclipse”.3ScienceDaily. (2025, November 6). JWST captures stunning 3D view of a planet’s scorching atmosphere. http://www.sciencedaily.com/releases/2025/11/251102011152.htm As the planet disappears, the total light measured by the telescope drops, because it is now only seeing the light from the Star. By subtracting the “Star-only” light from the “Star + Planet” light, astronomers can perfectly isolate the tiny fraction of light that was coming only from the planet’s hot dayside.
This is clever. But the mapping part is even more so. As the planet progressively disappears and reappears from behind the star, different “slices” of its dayside are blocked. This creates a very subtle, specific change in the “light curve,” which is a graph of brightness over time. The precise *shape* of this curve, as the planet is eclipsed, allows scientists to computationally reconstruct a 2D map of the planet’s surface brightness. This reveals its longitude and latitude.
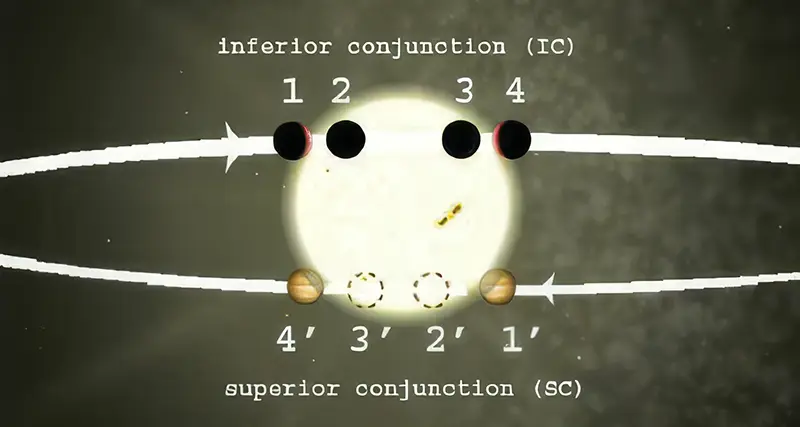
This diagram shows the ‘secondary eclipse’ method. Scientists first measure the total light from the ‘Star + Planet’ (left). As the planet moves behind its star (right), they measure the light from the ‘Star only’. The difference between these two measurements reveals the light coming from the planet’s atmosphere. Credit: ResearchGate / Angerhausen et al.
What Makes This Map “3D”?
This is where the “spectroscopic” part comes in. This is the critical innovation that only JWST makes possible. The telescope did not just measure the eclipse in one single color. Its instruments, in this case the Near-Infrared Imager and Slitless Spectrograph (NIRISS), measured the light curve across many different *wavelengths* of infrared light simultaneously. This multi-wavelength, or “spectroscopic,” approach is the key to the third dimension: altitude.
Why? Because an atmosphere is not uniformly transparent. Different gases, like water vapor, strongly absorb very specific wavelengths of light. Imagine you are looking at the planet through a set of high-tech goggles.
- At a wavelength where water absorbs light strongly, your “view” is blocked. You can only see the *upper* layers of the atmosphere, what scientists call the “water deck”.
- At a wavelength where water does not absorb, your “view” penetrates much *deeper* into the atmosphere.
This is the genius of the method. By creating a 2D map at *each individual wavelength*, the scientists are effectively creating maps of different atmospheric layers. When they “stack” these 2D slices together, each one probing a different altitude, they reconstruct the full 3D (longitude, latitude, altitude) temperature and chemical structure of the planet. As lead author Ryan Challener explained, “If you put those together, you can get a 3D map”.
What Did the 3D Map Actually Show?
The 3D map of WASP-18b revealed a world of violent extremes. It shows, for the first time, how a planet’s physics and chemistry are linked in three dimensions. The primary result is a full 3D temperature map charting the atmosphere by longitude, latitude, and altitude. This map revealed that the planet’s dayside is not a uniform, blazing surface. Instead, it is dominated by a “bright central hotspot” located right at the substellar point. This is the spot where the star’s light hits most directly. This region reaches temperatures of 2,760°C ( nearly 5,000°F).. Surrounding this inferno, the map shows a “cooler ring” near the planet’s visible edge, creating “distinct temperature zones” across the planet’s face.
The most striking discovery, however, is the chemical consequence of this intense heat. The 2,760°C temperature in the hotspot is so extreme that it “literally tears water molecules apart”. This process is known as thermal dissociation. It has long been theorized to occur on ultra-hot Jupiters, but the 3D map provides the first direct observational proof. The map clearly shows a “reduced water vapor” abundance *inside* the hotspot. The surrounding “cooler” (though still incredibly hot) regions show the expected presence of water. This confirms that the planet’s chemical composition is not uniform. It is instead a direct, three-dimensional function of its thermal structure.
These findings are not separate. They are part of a single, interconnected system, and the 3D map is the key to linking them. On many other hot Jupiters, like WASP-43b, astronomers expect extremely fast winds (upwards of 8,000 km/h or 5,000 mph) to smear the heat from the dayside. This would shift the hottest point eastward, away from the substellar point. The map of WASP-18b, however, shows a “bright central hotspot”. This indicates that this shift is *not* happening. This strongly implies that the winds on WASP-18b are inefficient at redistributing the star’s immense energy. This lack of efficient heat transport is precisely *why* the central hotspot is able to reach such extreme temperatures. In turn, this extreme temperature is the direct cause of the chemical change: the destruction of water molecules. The 3D map is the first tool that allows scientists to see this entire physical cascade all at once.
How Does This Compare to Past Discoveries?
This 3D map is the culmination of decades of progress in space-based astronomy. This entire concept originates with Dr. Lyman Spitzer’s visionary 1946 paper, “Astronomical Advantages of an Extra-terrestrial Observatory”.4STScI. (n.d.). STScI Timeline. https://www.stsci.edu/who-we-are/our-history/stsci-timeline That report argued for placing an observatory above Earth’s obscuring atmosphere, a concept that would eventually lead to the Great Observatories program.
The first of these was the Hubble Space Telescope (HST), launched in 1990.5Wikipedia. (2025). Hubble Space Telescope. https://en.wikipedia.org/wiki/Hubble_Space_Telescope Hubble’s contributions to exoplanet science were foundational. It was the first to use transmission spectroscopy (measuring starlight as it filters *through* a planet’s atmosphere) to detect elements. Hubble provided the first-ever “glimpses” of exoplanet atmospheres, detecting sodium, helium, and water vapor, proving that characterizing alien atmospheres was possible.6NASA. (n.d.). How We Find and Classify Exoplanets. NASA Science. https://science.nasa.gov/exoplanets/how-we-find-and-characterize/
The direct predecessor to JWST in this field was the Spitzer Space Telescope, launched in 2003.7NASA. (n.d.). Spitzer Space Telescope. NASA Science. https://science.nasa.gov/mission/spitzer/ Spitzer was a dedicated infrared observatory. It achieved two monumental milestones. In 2005, it was the first telescope to ever detect light from an exoplanet. It also created the first-ever “weather map” of an exoplanet.
So, what is the critical difference? Spitzer’s 2D maps were made using “phase curves”.8NASA. (n.d.). Exoplanet Phase Curve (Diagram). NASA Science. https://science.nasa.gov/asset/webb/exoplanet-phase-curve-diagram/ This technique involves observing the *entire* orbit of a planet, measuring how its total brightness changes as its dayside and nightside rotate into view. This method is “hemispherically-averaged” and can only constrain longitude, the east-west distribution of heat. This results in a flat, 2D map, often visualized as a “ribbon” of temperatures around the planet’s equator. JWST’s new “spectroscopic eclipse mapping” is fundamentally different. It uses the shape of the eclipse to map both longitude *and* latitude. By adding spectroscopy (the multi-wavelength “CAT scan”), it adds the third dimension: altitude. In short: Spitzer gave us a 2D “surface” map (longitude only). JWST has now delivered a true 3D “volume” map (longitude, latitude, and altitude).
Why Was This Only Possible with JWST?
The 3D map of WASP-18b was only possible because of the unique design of the James Webb Space Telescope. It was specifically engineered to be the most powerful infrared telescope ever built. Infrared light is the key to understanding three major areas of astronomy. First, it is the “light of heat”.9IPAC/Caltech. (n.d.). INFRARED ASTRONOMY – Overview. https://www.ipac.caltech.edu/Outreach/Edu/importance.html Any object with a temperature above absolute zero glows in infrared, making it the perfect wavelength for studying “cold” objects like planets. Second, infrared light passes right through cosmic dust clouds that block visible light, allowing JWST to study the birth of stars and planets. Third, due to the expansion of the universe, light from the very first galaxies has been “redshifted” all the way into the infrared spectrum. To see the dawn of time, one must look in the infrared.
But there is a problem. Infrared is heat. To detect faint infrared signals from distant planets, the telescope itself must be extremely cold. Otherwise, its own heat will blind its instruments. JWST must be cooled to below 50 Kelvin (-223°C or -370°F).10Wikipedia. (2025). James Webb Space Telescope. https://en.wikipedia.org/wiki/James_Webb_Space_Telescope This is impossible to do in Low Earth Orbit like Hubble, where it is constantly warmed by the Earth. Therefore, JWST was sent 1.5 million kilometers (1 million miles) from Earth to the Second Lagrange Point (L2).11NASA. (n.d.). Hubble vs. Webb. NASA Science. https://science.nasa.gov/mission/hubble/observatory/hubble-vs-webb/ From this stable point, the Sun, Earth, and Moon are always in the same part of the sky. This allows the telescope to unfurl a massive, 5-layer, tennis-court-sized sunshield to block the heat from all three simultaneously. This shield keeps the telescope in a permanent, frigid shadow. To capture the faint infrared light, JWST needs a giant mirror. Its primary mirror is 6.5 meters (21 feet) across, giving it over six times the light-collecting area of Hubble.12Royal Museums Greenwich. (n.d.). James Webb Space Telescope | Capabilities, First Images, Hubble Comparisons. https://www.rmg.co.uk/stories/space-astronomy/james-webb-space-telescope-vs-hubble-space-telescope The mirror segments are coated in gold because gold is exceptionally effective at reflecting infrared light.13Reddit. (2015). Size comparison between the Hubble and the James Webb primary mirrors. https://www.reddit.com/r/space/comments/3ue67s/size_comparison_between_the_hubble_and_the_james/ This entire design was necessary to make this 3D map possible.
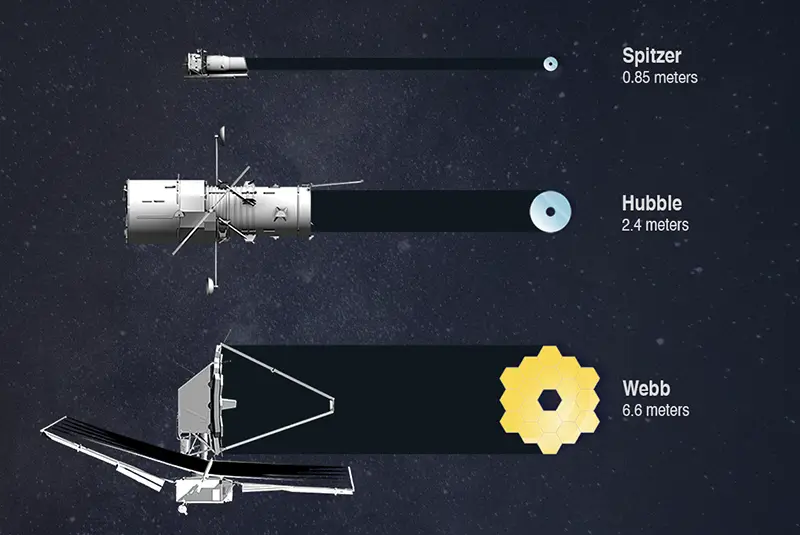
This 3D map was only possible thanks to a massive leap in technology. JWST’s 6.6-meter mirror (bottom) has over 6 times the light-collecting area of Hubble’s (middle) and is vastly larger than Spitzer’s (top), allowing it to capture the faint infrared light from distant exoplanet atmospheres. Credit: NASA/ESA/CSA
What is the Next Step for 3D Planet Mapping?
The successful 3D mapping of WASP-18b is not an end-point. It is the “demonstration of a new technique” that opens up a new frontier in planetary science. This technique changes how we think. Scientists can now move from 1D and 2D models to directly test 3D climate models of exoplanets. As the researchers stated, they can “begin mapping atmospheric variations… just as, for example, Earth-based telescopes long ago observed Jupiter’s Great Red Spot”. This is the birth of true comparative exoplanetology.
This discovery does come with a major practical limitation. The 3D mapping technique is extremely powerful, but it requires long observation times on a highly sought-after telescope. JWST is a “general observatory”. Astronomers from all fields (cosmology, galaxy evolution, and solar system science) are competing for its time. The telescope is “oversubscribed”. Therefore, it is not feasible to use this method on all 6,000+ known exoplanets. It is currently limited to high-signal targets like “ultra-hot Jupiters” that provide a strong, clear signal.
The immediate next step is to apply this 3D mapping technique to a “broad range of exoplanet atmospheres,” specifically other hot Jupiters. This will allow scientists to compare and contrast their 3D structures and build a new classification system based on their 3D climates. The ultimate, long-term goal is to apply this technique to smaller, cooler, rocky planets. This is vastly more difficult, as the atmospheric signal from an Earth-sized planet is incredibly faint. However, this remains the central goal of the field: to map worlds that may be habitable.
JWST is the trailblazer that proves the technique works. To conduct “population-level mapping studies” (that is, to perform this analysis at scale) a dedicated mission is required. The upcoming Ariel mission, for example, is a “dedicated exoplanet mission” specifically designed to “observe 1000 transiting exoplanets”.14ArXiv. (2025). Eclipse Mapping with Ariel: Future Prospects for a Population-Level Mapping Survey. https://arxiv.org/html/2510.03147v1 This is the true next step: moving from JWST’s groundbreaking proof-of-concept to a large-scale survey of alien atmospheres. For the first time, we are no longer just finding new worlds. We are beginning to explore them.